 Sign Up
Exemplar Story Collection
6th-8thScience and Engineering
Riley's Story on Epidemics and Pandemics
![]() 8th
8th
![]() 45-60 min
45-60 min
![]() Science, Interpreting Graphs
Science, Interpreting Graphs
Created by Beth Selig, Fuquay-Varina Middle School, North Carolina
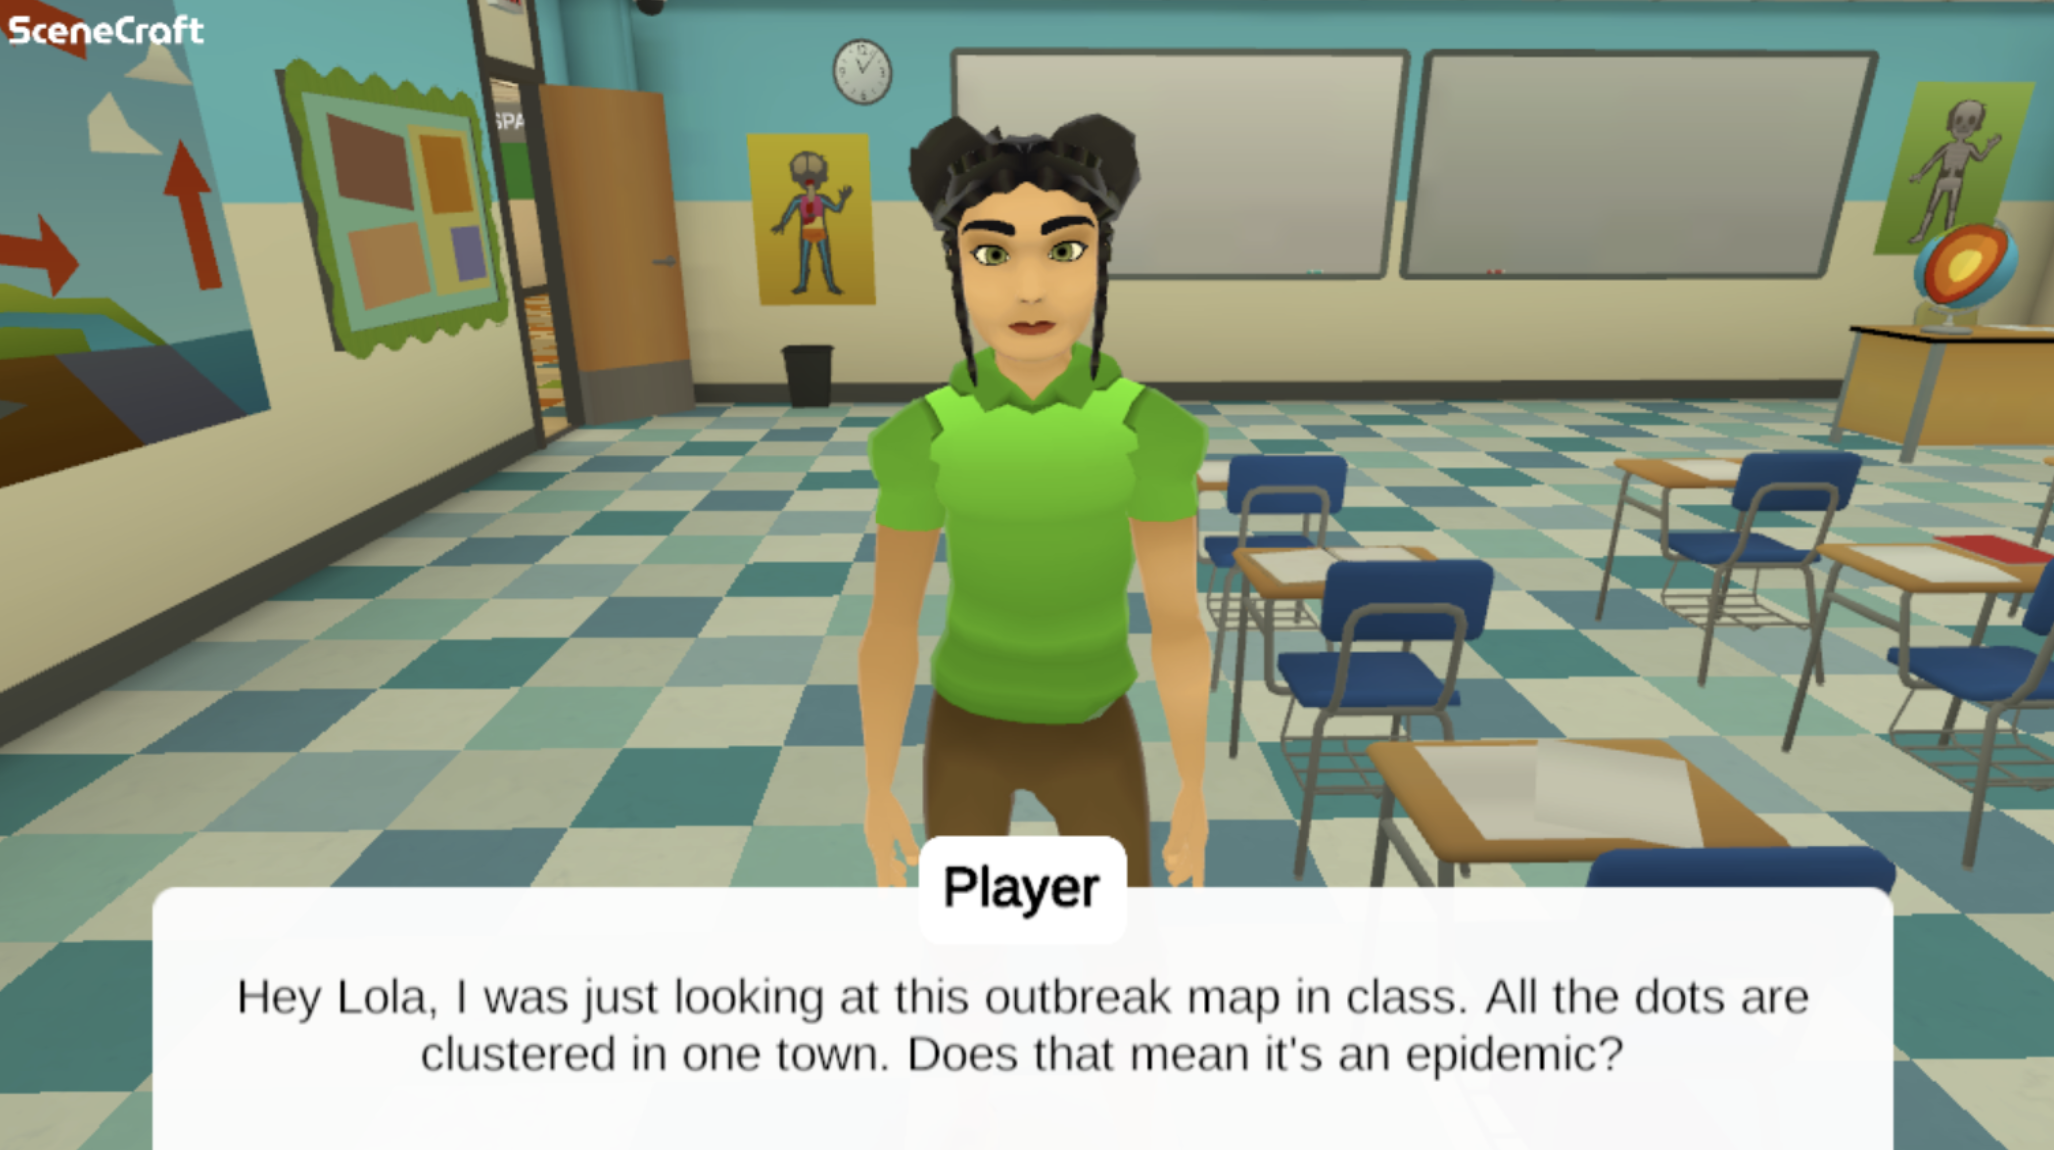
Graphs are a challenge for middle school students to analyze and interpret the meaning. The story is designed to complement the graphs, so that students can interpret and analyze the data on epidemics and pandemics.
Connects to Standard: LS.8.1.2 Analyze and interpret data to explain the difference between epidemic and pandemic as it relates to the spread, treatment and prevention of disease.